The best LLM observability tools in 2026 are Langfuse for open source, self hosted tracing with prompt management and evals; LangSmith for teams built on LangChain and LangGraph; Arize Phoenix for free, OpenTelemetry native tracing you can run in one container; and Braintrust or W&B Weave if you want a hosted platform centered on experiments. Opik, Laminar and OpenLLMetry are strong open source alternatives. Helicone still works but has been in maintenance mode since its March 2026 acquisition, so it is a weaker pick for new projects.
Ownership in this market changed fast in 2026, so this guide covers licenses, self hosting footprint and who now owns each product, alongside features.
What is LLM observability?
LLM observability means recording what your AI app does in production: each prompt, response, tool call, latency and token cost, linked together as traces. Teams use it to debug bad answers, catch regressions after a prompt or model change, control spend and feed real examples back into evals. Traditional application monitoring tells you a request took two seconds and returned a 200; LLM observability tells you what the model was asked, which documents were retrieved, which tools were called and whether the answer was any good.
What gets logged: traces, spans, tokens and cost
A trace is the record of one request from start to finish. Inside it, each step is a span: a model call, a retrieval, a tool call or a bit of your own code, with its input, output, latency and errors. Model call spans also carry token counts, from which tools compute cost per request, per user or per feature. Datadog's documentation, for example, describes a trace as a single model call, a fixed workflow of calls and tool steps, or a dynamic workflow run by an agent (Datadog docs). On top of that raw data, the tools add:
- Sessions and users: grouping traces into conversations, so you can replay what a user experienced.
- Evaluation: attaching scores to traces, from user feedback, code checks or LLM judges, and running experiments on datasets.
- Prompt management: versioning prompts outside your code and linking each trace to the prompt version that produced it.
- Dashboards and alerts: cost, latency, error and quality trends over time.
Observability vs monitoring vs evals
Monitoring answers "is it up and how fast is it?" with aggregate metrics. Observability keeps the full detail of each request so you can ask new questions later, such as "which retrieved document led to this wrong answer?" Evals answer "is it good?" by scoring outputs against a test set or a rubric, before release or on sampled production traffic. In practice the three meet in one loop: traces show you failures, the failures become eval cases, and evals tell you whether a fix worked. Our guides to how to evaluate LLM applications and AI agent observability cover the eval and agent sides.
OpenTelemetry and open standards
Most tools now accept OpenTelemetry data, the open standard for traces. The generative AI semantic conventions, which define attribute names for model calls, moved in 2026 to their own repository at open-telemetry/semantic-conventions-genai. Instrumenting with OpenTelemetry, directly or through libraries such as OpenLLMetry, keeps you portable if you switch vendors later.
How to start in a day
- Pick one backend from the table below; a free cloud tier or a single container is enough to start.
- Add the vendor SDK or an OpenTelemetry instrumentation library to the one service that calls the model.
- Tag every trace with a user or session ID and the prompt version, so you can filter later.
- Ship a day of real traffic, then sort traces by cost, latency and negative user feedback.
- Save the ten worst traces as the first rows of an eval dataset.
The full directory of tools is on our observability category page.
LLM observability tools compared
| Tool | License | Self host | Owner (Oct 2026) | Best for |
|---|---|---|---|---|
| Langfuse | MIT core, separate enterprise directories | Yes, free | ClickHouse | Open source default with prompts and evals |
| LangSmith | Proprietary | Enterprise plan only | LangChain | LangChain and LangGraph teams |
| Arize Phoenix | Elastic License 2.0 | Yes, free, single container | Arize, now part of Dynatrace | Simple self hosting, OpenTelemetry native |
| Opik | Apache 2.0 | Yes | Comet | Open source tracing plus evals and optimization |
| W&B Weave | Apache 2.0 SDK; hosted platform | Dedicated Cloud or self managed, via sales | Weights & Biases, part of CoreWeave | Teams already on Weights & Biases |
| Laminar | Apache 2.0 | Yes | Independent | Long running agent traces, OpenTelemetry native |
| OpenLLMetry | Apache 2.0 | Instrumentation only | Traceloop, part of ServiceNow | Vendor neutral instrumentation |
| Braintrust | Proprietary; MIT autoevals library | Enterprise hybrid or on prem | Independent | Eval centered hosted platform |
| HoneyHive | Proprietary | Contact vendor | Independent | Hosted agent tracing and online evals |
| Helicone | Apache 2.0 | Yes | Mintlify, maintenance mode | Existing users of its gateway |
Read as a list: Langfuse, Phoenix, Opik and Laminar can all be self hosted for free; LangSmith, Braintrust and HoneyHive are hosted first products; OpenLLMetry is an instrumentation library that sends data to any backend rather than a full platform; and Helicone is maintained but not getting new features.
The tools in detail
Langfuse
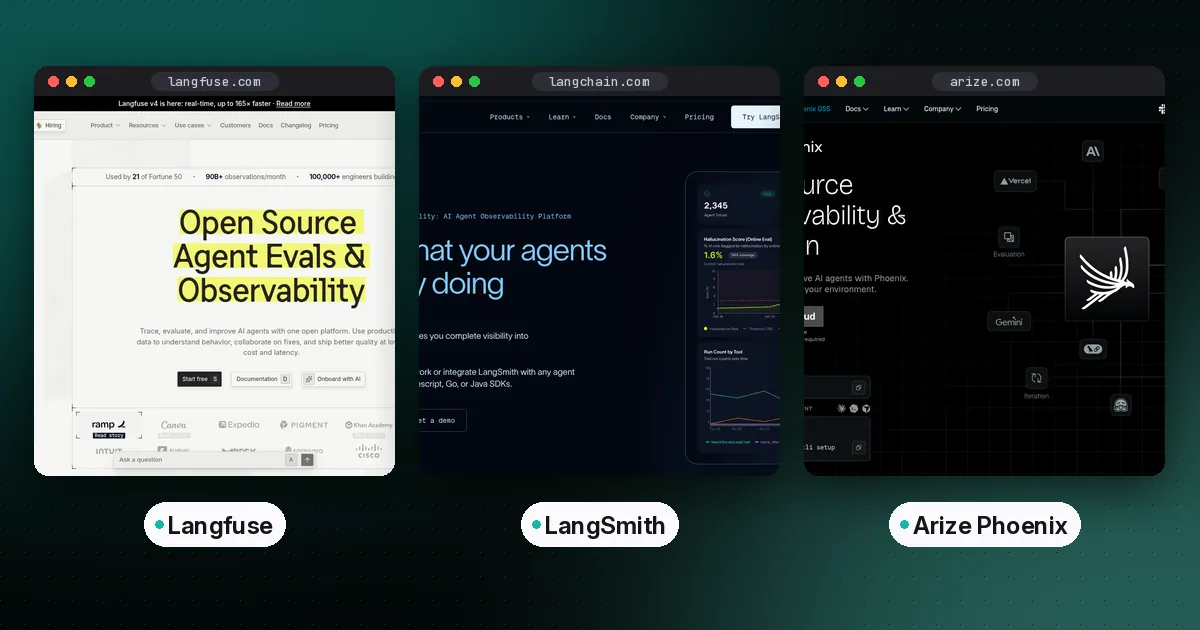
Langfuse is the most widely recommended open source option. It covers tracing, sessions, prompt management, datasets, experiments, human annotation queues and LLM-as-a-judge evaluators, and it is built on OpenTelemetry. ClickHouse acquired it in January 2026; the team says there are no planned licensing changes and self hosting stays first class (announcement).
The tradeoff is operational: a production self host runs PostgreSQL, ClickHouse, Redis or Valkey, and S3 compatible blob storage. Langfuse Cloud has a free Hobby tier with 50,000 billable units a month, and paid plans start at 29 dollars a month (pricing).
LangSmith
LangSmith, from the LangChain team, gives the tightest integration with LangChain and LangGraph, where tracing can be switched on with environment variables. It includes evals, prompt tooling and deployment features. The Developer plan is free for one seat with 5,000 base traces a month; Plus is 39 dollars per seat per month with 10,000 base traces, and self hosting or hybrid deployment requires the Enterprise plan (pricing). We compare it head to head in Langfuse vs LangSmith.
Arize Phoenix
Arize Phoenix is free to self host with no usage limits or feature gates and runs as a single Docker container. It uses OpenTelemetry and Arize's OpenInference conventions and includes evals, datasets, experiments and prompt tooling. Its license is the Elastic License 2.0, which is source available rather than an OSI approved open source license; that matters mainly if you plan to offer Phoenix as a hosted service. Dynatrace completed its acquisition of Arize on October 1, 2026, and says it will keep supporting Phoenix (press release). See our Langfuse vs Arize Phoenix comparison for a detailed look at self hosting both.
Opik
Opik, from Comet, is Apache 2.0 licensed and self hostable. It records LLM calls, tool calls and agent steps, scores them with built in and custom metrics, and adds prompt optimization features. Comet remains independent, which some buyers now weigh after a year of acquisitions.
W&B Weave
W&B Weave is the LLM tracing and evaluation product of Weights & Biases, which is now part of CoreWeave. It is a natural fit if your team already tracks training runs in W&B and wants traces and evals in the same place.
Laminar and OpenLLMetry
Laminar is an Apache 2.0, OpenTelemetry native platform aimed at agents that run for hundreds of steps, with features such as session replay for browser agents and full text search across traces. OpenLLMetry is not a dashboard but a set of OpenTelemetry instrumentations for model providers and frameworks; it can send traces to Langfuse, Phoenix, Datadog or any OTLP backend. Traceloop, its maker, joined ServiceNow in March 2026 and says OpenLLMetry will remain open source (Traceloop blog).
Braintrust and HoneyHive
Braintrust is a hosted platform built around evaluation: datasets, experiments, scorers and production logging. It has a free Starter tier and a Pro plan listed at 249 dollars a month (pricing). HoneyHive offers hosted tracing, online evaluations, monitoring, alerts and annotation queues for agent applications; see its site for pricing.
Helicone
Helicone pioneered the one line proxy approach: route model calls through its gateway and get logging, cost tracking and caching. Mintlify acquired it in March 2026, and Mintlify says the service stays live in maintenance mode with security updates, bug fixes and new models, and that it will help customers move to another platform (Mintlify announcement). Existing users are fine for now; new projects should prefer an actively developed tool.
How to choose
- Decide where data may live. If traces cannot leave your infrastructure, shortlist Langfuse, Phoenix, Opik or Laminar, or budget for an enterprise self host of a hosted product.
- Match your framework. Heavy LangChain or LangGraph users get the smoothest start with LangSmith; everyone else should favor OpenTelemetry based tools.
- Decide how central evaluation is. If experiments and CI gates are the main job, look hard at Braintrust, Langfuse or Phoenix, and read our playbook on how to evaluate LLM apps.
- Price your real volume. Pricing units differ: Langfuse bills per unit, meaning traces, observations and scores, while LangSmith combines seats with trace counts. Estimate with your own traffic.
- Check ownership and license. After the 2026 acquisitions, confirm the license, the roadmap commitment and the migration path before you commit.
Pros and cons of open source versus hosted
Open source, self hosted
- Pros: data stays in your environment, no per seat fees, no vendor lock in.
- Cons: you run and upgrade the databases, and someone has to own it when things break.
Hosted
- Pros: fast setup, managed scaling, enterprise support and compliance reports.
- Cons: per seat or usage costs grow with traffic, and data residency may require an enterprise contract.
Who each tool is for
Langfuse suits most teams that want one open source platform for traces, prompts and evals. LangSmith suits LangChain centric teams that prefer a managed product. Phoenix suits teams who want the lightest free self host. Opik and Laminar suit teams who want open source from an independent vendor. Braintrust suits eval driven teams happy with a hosted product. If you mainly need retrieval quality metrics, pair any of these with the libraries in our RAG evaluation metrics guide, and use the LLM-as-a-judge guide to set up trustworthy automated scores. If the unit of work is a multistep tool loop rather than a single completion, read AI agent observability for the Partnership on AI telemetry gaps and agent shaped monitoring checklist.
FAQ
What is LLM observability?
LLM observability means recording what your AI app does in production: each prompt, retrieved context, tool call, response, latency and token cost, linked as traces. Teams use it to debug bad answers, catch regressions, control spend and turn real failures into eval cases.
What are the best open source LLM observability tools?
Langfuse, which has an MIT licensed core, Opik and Laminar, both Apache 2.0, are fully open source and self hostable. Arize Phoenix is free to self host but uses the source available Elastic License 2.0. OpenLLMetry provides open source OpenTelemetry instrumentation that feeds any backend.
Is Langfuse free?
Yes, if you self host it: the open source core is free with no usage limits. Langfuse Cloud also has a free Hobby plan with 50,000 units a month and two users; paid cloud plans start at 29 dollars a month.
Does Datadog have LLM observability?
Yes. Datadog's LLM Observability product now appears as Agent Observability in its documentation, and it bills on LLM spans, meaning calls to a model provider, rather than on every span in a workflow (Datadog docs). It suits teams that want LLM traces next to existing infrastructure and APM data. For cost math against an open source option, see Datadog LLM Observability vs Langfuse.
Do I need OpenTelemetry for LLM tracing?
Not strictly, since most tools have their own SDKs, but instrumenting with OpenTelemetry keeps your traces portable between vendors. Langfuse, Phoenix, Laminar and OpenLLMetry are all built around it.