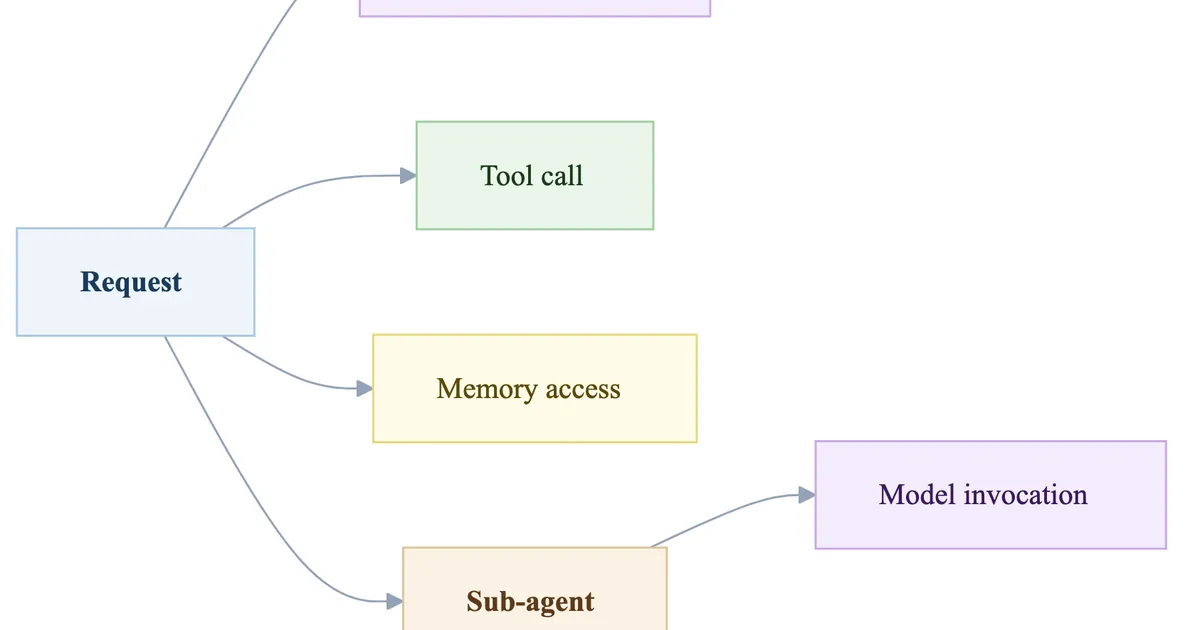
AI agent observability is the practice of recording every step an agent takes (model calls, tool invocations, retrievals, permission changes, and control flow decisions) as structured traces you can inspect, score, and alert on. It extends ordinary LLM observability from single completions to multistep tool loops, where a plausible final answer can still hide a wrong tool pick, a permission escalation, or a memory drift mid run. In October 2026 that gap stopped being theoretical: Partnership on AI published The Observability Gap in AI Agents, and mainstream coverage such as the Christian Science Monitor amplified the finding that four widely used agent frameworks still miss records enterprises need for real time monitoring.
This guide defines AI agent observability, lists the six telemetry gaps PAI measured, shows how OpenTelemetry fits, and compares practical tools, Langfuse, Arize Phoenix, OpenLLMetry, Laminar, LangSmith, HoneyHive, and others, without turning into a how to for building agent frameworks.
What AI agent observability covers
A single LLM call needs prompt, completion, latency, and token cost. An agent needs that plus the loop around it. Langfuse's own definition is a useful checklist (Langfuse agent observability guide):
- LLM generations: prompts, completions, model parameters, tokens, and cost per step.
- Tool calls: which tools were offered, which one the model chose, arguments, and results.
- Control flow: subagents, handoffs, retries, and how often the loop iterated.
- Context: prompt version, retrieved documents, and the message history the model actually saw.
- Sessions and users: grouping multiturn runs so you can replay one conversation.
- Quality signals: user feedback, code checks, and LLM as a judge scores attached to the same trace.
Failures usually hide mid trace. An agent can call the wrong tool, retrieve the wrong document, or loop on a failing step and still emit a confident final answer. Cost also behaves differently: the agent decides how many model and tool calls a task takes, so spend has to be attributed per trace, user, and model in real time.
Agent observability is not the same as choosing an agent framework. Frameworks emit telemetry; observability platforms store, query, and evaluate it. Stay on this side of the line: instrument and monitor. Building crews, graphs, or MCP servers belongs in agent infra documentation, not here.
The six PAI telemetry gaps (October 2026)
Partnership on AI assessed OpenAI's Agents SDK, Anthropic's Claude Agent SDK, LangGraph, and CrewAI against six safety monitoring goals. The report, dated October 7, 2026, finds six categories of telemetry that frameworks emit inconsistently or not at all (PAI report; PDF: What to Fix Before Agents Scale):
| Gap | Why it matters |
|---|---|
| Persistent agent identity | Run scoped names cannot be checked against enterprise permissions or followed across subagents |
| Permission mode changes | Only Claude Agent SDK clearly records mid session permission shifts; others may leave no audit trail if approval is dropped |
| Memory changes | Drift that starts in memory often shows up only after decisions have already shifted |
| Human intervention | Missing who approved, under what authority, and why makes rubber stamp review hard to spot |
| Chain of thought reasoning | Frameworks usually get only post hoc summaries from model providers, which limits "why" audits |
| Token level log probabilities | Rarely emitted as structured telemetry; a weak but sometimes useful confidence signal |
PAI groups the first four as records of what happened, fixable by standardizing emissions, and treats reasoning and logprobs as harder how it decided signals that need more research before mandates. The report's practical recommendation for most gaps is to build on OpenTelemetry and have framework vendors emit the missing fields.
CS Monitor's October 7 writeup restates the same six blind spots for a broader audience and quotes PAI on why OpenTelemetry adoption is the realistic path for the "what happened" gaps (CS Monitor). Treat PAI as the primary source; use press coverage only as confirmation that the topic is actively searched.
OpenTelemetry and GenAI conventions
What's new (October 17, 2026): Anthropic launched OpenTelemetry export in beta on October 14, so you can trace Messages API requests and Claude Managed Agents sessions in your own observability backend. The Claude SDK emits spans in Python, TypeScript, C#, Go, Java, PHP and Ruby, and API spans need an OpenTelemetry destination added in the Claude Console, per Anthropic's release notes. Separately, Galileo now sells its platform as Splunk Agent Observability after Cisco's acquisition; galileo.ai/pricing now redirects to Splunk's pricing page, which lists it from $100 per month per 1.2 million spans, billed annually.
The industry is converging on OpenTelemetry (OTel) as the pipe between agent runtimes and observability backends. OpenTelemetry's GenAI work defines semantic conventions for model calls, agent spans, tool executions, and related metrics; many backends already accept OTLP traces that follow those attributes (OpenTelemetry on AI agent observability; GenAI conventions live in open-telemetry/semantic-conventions-genai).
Two instrumentation patterns show up in practice:
- Baked in framework telemetry that emits OTel spans when you flip a config flag.
- External instrumentation such as OpenLLMetry (Traceloop) that wraps providers and frameworks and forwards OTLP to any compatible backend.
Either way, the win is portability: instrument once, send traces to Langfuse, Phoenix, Datadog, Grafana Tempo, or another OTLP consumer without rewriting app code. PAI's "standardize what happened" recommendation maps directly onto this stack.
Agent observability tools compared
You do not need a new product category named "agent observability" to get started. You need a tracing backend that understands nested tool loops, plus instrumentation that reaches it. Here is how common options map to agent work as of October 2026:
| Tool | Role for agents | Self host | Notes (Oct 2026) |
|---|---|---|---|
| Langfuse | Full platform: typed agent/tool observations, graphs, evals | Yes (MIT core) | Strong OTel ingest; ClickHouse owned |
| Arize Phoenix | Free single container tracing + evals | Yes (ELv2) | Dynatrace closed Arize on Oct 1, 2026; Phoenix support continues |
| OpenLLMetry | Instrumentation only (OTLP out) | N/A | Send to any backend; Traceloop → ServiceNow |
| Laminar | Long horizon / high step agent traces | Yes (Apache 2.0) | Session replay focus for browser style agents |
| LangSmith | Best fit if you already run LangGraph | Enterprise for self host | Tight LangChain/LangGraph integration |
| Opik | Tracing + evals + optimization | Yes (Apache 2.0) | Comet; still independent |
| HoneyHive | Hosted agent tracing and online evals | Contact vendor | Agent oriented hosted workflows |
| Braintrust | Eval centered hosted platform | Enterprise hybrid | Strong when CI gating matters more than UI polish |
| Datadog Agent Observability | Hosted agent tracing, evals and experiments inside Datadog | No (hosted only) | Renamed from LLM Observability; bills only LLM spans |
| Splunk Agent Observability | Enterprise agent monitoring (Cisco/Galileo lineage) | Splunk stack | Product page: Agent Observability |
For a full license and pricing tour of the LLM observability market, use Best LLM observability tools. This table only answers "which of those tools help when the unit of work is an agent loop."
Datadog's rename matters for this search. Datadog now sells its former LLM Observability product as Datadog Agent Observability. Per its product page, it bills only on LLM spans (one call to a model provider); tool, workflow, agent, embedding and retrieval spans are free. The Free plan covers up to 40K LLM spans a month and Pro starts at $160 a month for 100K, both with 15 day retention. The same page offers free local tracing of apps and coding agents with no signup. If your services already report to Datadog, it is the shortest path; our Datadog vs Langfuse comparison covers the cost math and self hosting tradeoff.
Ownership moves to watch in late 2026: Dynatrace completed its Arize acquisition on October 1, 2026 and says Phoenix remains available. Cisco's Galileo technology now powers Splunk Agent Observability. Neither change removes open source options; both explain why "agent observability" is showing up in enterprise search and vendor marketing at the same time as the PAI report.
What to monitor beyond latency
If your dashboard only shows p95 latency and token cost, you are still doing classic LLM observability. For agents, add signals that map to PAI's gaps and to production failure modes:
- Tool call shape: count of tool calls per run, dead tools (available but never called), and sensitive tools that fired.
- Loop health: steps per task, retry storms, and traces that hit a step budget.
- Authority and permissions: whether permission mode changed mid session, and whether actions stayed inside the granted scope (where the framework emits that field).
- Memory and context drift: when memory writes happen and which step triggered them, if your harness records it.
- Human review quality: who approved, why the review triggered, and the decision, not just a boolean "approved."
- Task success vs policy success: an agent can complete a task through an unauthorized action; score both outcome and constraint adherence. Observability cannot replace testing: pair it with red teaming and prompt injection tests so production monitors are not your only line of defense.
Online evaluation closes the loop: attach binary pass/fail scorers (preferred over vague 1 to 5 scales) to live traces, promote failing traces into datasets, and gate releases in CI. Braintrust and Langfuse both lean into that workflow; see also how to evaluate LLM applications.
How to choose a starting stack
| Situation | Practical start |
|---|---|
| Want open source and self host | Langfuse or Phoenix + OpenLLMetry (or native OTel) |
| Already on LangGraph | LangSmith first; still emit OTel if you may switch later |
| Hundreds of steps per run | Laminar or Langfuse with filters / log view, not raw scroll only UIs |
| Eval gating in CI is the priority | Braintrust or Langfuse experiments + datasets |
| Enterprise already on Splunk / Dynatrace | Evaluate Splunk Agent Observability or Dynatrace+Arize against your OTel pipeline before adding a fifth vendor |
Default recommendation for most independent teams: instrument with OpenTelemetry (or OpenLLMetry), ship traces to Langfuse or Phoenix, and add binary evaluators on tool choice and task completion before you invent custom dashboards. Revisit PAI's six gaps quarterly against whatever your framework actually emits. Platform choice cannot invent telemetry the harness never recorded.
From Ahzy Capital (our own products, labeled as such): Get the free AI Agent Cheat Sheet: 24 copy and paste AI agent setups for 8 types of small business, with prompts and workflows. We make and sell these, so they aren't independent picks.
FAQ
What is AI agent observability?
It is tracing and monitoring for multistep AI agents: every model call, tool call, retrieval, and control flow decision in a run, plus sessions, costs, and quality scores. It differs from single completion LLM logging because failures and policy violations often appear in intermediate steps.
How is agent observability different from LLM observability?
LLM observability focuses on prompts, completions, and retrieval for one or a few model calls. Agent observability treats the tool loop as the unit of analysis: nested tools, subagents, retries, permissions, and long traces with hundreds of observations.
Which agent observability tools are open source?
Langfuse (MIT core), Opik (Apache 2.0), Laminar (Apache 2.0), and OpenLLMetry (Apache 2.0 instrumentation) are common open or source available choices. Arize Phoenix is free to self host under the Elastic License 2.0 (source available, not OSI open source).
What are the best AI agent observability tools?
For open source and self hosting, Langfuse or Arize Phoenix paired with OpenLLMetry or native OpenTelemetry is the common start. LangSmith fits teams already on LangGraph, Laminar fits very long agent runs, and Braintrust fits teams that gate releases on evals. The comparison table above maps each one to agent work.
How much does AI agent observability cost?
It can start at zero. Langfuse (MIT core), Phoenix and Opik can be self hosted for free. Hosted plans vary: Datadog Agent Observability is free up to 40K LLM spans a month and Pro starts at $160 a month, while Splunk lists Agent Observability from $100 a month per 1.2 million spans on annual billing. Check each vendor's page, since prices change.
Do I need OpenTelemetry for AI agent observability?
You do not strictly need it, but it is the safest default. OTel GenAI semantic conventions and OTLP keep instrumentation portable across backends, which is also what PAI recommends for closing most telemetry gaps.